
Changing our energy legacy
“Philip Larkin famously proposed that what will survive of us is love.
Wrong. What will survive of us is plastic, swine bones, and lead-207,
the stable isotope at the end of the uranium-235 decay chain.”
Robert MacFarlane, Underland
The world has a solution to its growing energy crisis; it now needs to deploy it quickly, and shift our energy legacy from waste to light.
A Short Word on the Apocalypse
The world, according to BP, consumed 13.8 billion tonnes of oil equivalent in 2018, up 2.9% on 2017.
This rise was seen as a big deal, as it was well above the prior decade norm of 1.5% pa. growth.
BP ascribed these changes mainly to weather effects, suggesting a negative feed-back loop from climate change that requires more energy to manage the effects of more energy use; others noted the pro-fossil fuel policies dominating the US, CIS and Middle East governments.
Technology developments have therefore been relegated recently in the energy transition narrative: the latest argument goes that incumbent fossil fuel energy is required to meet the uptick in demand, and that it is backed by the policies of powerful supplier regimes.
Hence the transition will be further delayed.
Add to this the increased obviousness of climate change and its militant out-rider weather disruption, and a fatalism has entered the general world-view of most energy and environmental analysts.
Popular tomes on the future of the planet are deeply pessimistic: Wallace-Wells’ The Uninhabitable Earth is doom-laden from the first sentence “It is worse, much worse than you think.” In passing he also notes that four of the past five global extinction events were related to climate change – not asteroids (the exception the one that removed the dinosaurs).
The quote above from Robert MacFarlane’s Underland is almost an early requiem for our generation’s final legacy.
And Bill McKibben’s Falter is equally gloomy; but at least in his analysis there is the possibility of a savior: solar and wind energy.
Here in dollarsperbbl we agree: in energy we are technological determinists.
We believe that the new technologies of wind and solar are so powerful that they will transform energy today and for millennia to come – and they had better because how to satisfy the needs of billions of souls across deep time.
Energy Consumption is not the same as Energy Demand …
When humankind embarked on a thermal trajectory for its energy development, it entered a provisional, temporary contract.
Because the Second Law of Thermodynamics, the law that sets hard universal limits on thermal energy efficiency, is severe.
It means that almost two-thirds of the thermal fuel-based energy we consume today is lost to the world at large as heat and emissions.
And cursed by the Second Law, as long as we stay on a thermal course, that ratio will hold fast.
The various engines and technologies invented across the centuries of thermal fuel use reached their efficiency limits of about 25% (cars) to 40% (state of the art power stations, including nuclear) long ago: the Second Law prevents any further progress, as long as you use combustion as your mode of energy creation.
So, although as BP notes we “consume” 13.8 billion tonnes (equivalent), we only use about 5 billion tonnes (equivalent) usefully.
…and the difference is chaos
The rest is that vast tail of unused energy, and science has a precise word for it: entropy, disorder, energetic chaos.
Chemists sum it up much more practically in a very simple equation:
Carbon fuels + oxygen = energy + CO2 + water + heat, the physical manifestation of molecular disorder.
(Gas, oil, coal and biomass also generate SOx / NOx too, sulphur and nitrogen oxides, which are significant health hazards)
A quick rule of thumb is that for every tonne of fossil fuel burned, you create 2.5 tonnes of CO2: as BP’s tables show we burnt 13.8 billion tonnes of oil equivalent in 2018, and generated 34 billion tonnes of CO2.
This is our current energy system: efficient at best at 38%, generative of massive climate-forcing CO2, and creative of day to day health-hazardous acidic gaseous emissions.
Enough – we need to move on with the transition from thermal energy to its final alternative: electricity.
Global Energy Supply to be dominated by Solar and Wind: A Modest Proposal
To get out of this large literal excavated thermal hole, we need to think less about energy driven by the weight of fluids, and more about it being driven by the infinite movement of light and wind (plus an honorable mention for hydro-power).
This switches us now toward a fundamental piece of energy logic.
When solar or wind (or water) energy is converted by a technology to electricity, whether using solid-state physics to convert photons, or harness kinetic gas energy (wind) to turn a turbine blade, or water movement, that conversion occurs at 100%.
As we noted here: “Wind and solar become “energy products” at the point of generation of electricity. their “primary energy equivalent” is the electricity generated.”
This is different concept from capacity factors – ie how much the technology at hand can convert the light or wind or water.
For example, solar cells convert about 25% of light received into electricity only because of limited daylight irradiation: but if an amount of X electricity is required eg to light and heat a home, 4X of suitably-sized PV panels fixes the problem. Economically there is a loss: but in physics terms all that light gets converted to the requisite electricity. (This is why, as solar costs plummet, it may be cheaper to overbuild electricity requirements and reduce the need for storage).
When a solar cell converts light to electricity, that is a 1-1 activity – there is no burning discharges or thermodynamic losses to consider.
Put another way: as the “fuel” is infinite and omnipresent, the only issue is the conversion technology practicalities: the electricity created is gross and net the same. Thus wind and solar create high quality electrical energy as their primary energy, versus lower quality, disordered thermal energy.
As PV panels and wind turbines are manufactured more and more inexpensively, and globally deployed, the “levelized” cost of their energy starts to tend not just toward fossil fuel levels (already achieved), but toward zero running costs.
This means that it now makes financial sense to shutter existing thermal coal or gas plants, as well as cancelling the building of new ones, and replace them with energy derived from daylight and air.
Joules all the way down
Over 42% of all energy used today is used to make electricity, and last year electricity use grew at 3.7%pa.
At that rate electricity will be over 50% of all energy used by 2024 – so we really should start to use the unit of electrical energy – the Watt hour (Wh) – as a baseline rather than one based on declining liquid fuels.
Conversion of MTOE to Wh is simple in basic science units – because thermal and electrical energy are interchangeable.
How so?
The SI (international system) unit of energy is the Joule, named after a British Victorian engineer: it is personally named because it is a derived unit.
That means it is an aggregate of more fundamental SI units of weight, length and time – the basic unit being how much energy is takes to move a 1kg weight with acceleration across 1 metre. (Which though precise, means at the global scale, we have to juggle with lots and lots of joules).
So, for example, gasoline energy is measured in megaJoules per kg: so when you burn lots of kg, or tonnes, of oil or gas you get back to Joules.
Similarly a Watt, named after another British Victorian engineer, another derived unit, is the measure of power, meaning the use of energy (Joules) per second. Multiply that by time (eg hours) and back we are to Joules.
BP has even created a table of world energy per capita in raw Exajoules. (10 to the power 15 joules)
Key message – it’s all energy, it’s all joules, all the way down.
So, with the world “consuming” 13,800 MTOE that should that should create about 165,000TWh of usable energy to meet demand.
But we know it doesn’t.
BP reckon the conversion rate is about 38% for electricity in the power sector. And the conversion rate for non-electrical energy use (heat, transport, chemicals) will likely be less eg 25% for transport fuels.
But let’s take a big simplifying and incumbent-generous assumption and calculate that all that thermal fuels, and that includes biomass (“renewable” apparently) and nuclear, that are “consumed” convert to TWh at the 38% efficiency rate (in BP language that’s 1MTOE = 4.4 TWh).
That is the usable energy the world gets from thermal fuels.
You add up the actual MTOE consumption for coal, gas, oil, nuclear, biomass and convert and – what do you get?
About 55,000 TWh.
The 110,000 TWh gap is all those losses.
In fact it’s a bit less than that, because hydro, wind and solar (now 11% of primary energy demand) actually produce their TWh at 100%, as we noted.
So the effective TWh conversion is more like 150,000TWh, and the losses therefore about 95,000 TWh.
OK – so this rough double-book accounting creates a ledger for world primary energy demand broken into three in order of current size:
• Unused entropic (disordered) thermal energy (along with emissions)
• Useful thermal energy, and
• Useful conversion technology energy (WSH, wind, solar, hydro)
Let’s look at the predicament we are in.
Analysts often use flowcharts or Sankey diagrams to do this – in the one highlighted here for the US in 2018 it’s clear how much thermal loss there is (and the beginnings of wind/solar impact at the margins).
But we don’t need a detailed mass balance chart to make the obvious clear.

The tree diagram below shows how for all the seeming heft and size of the world energy system, the energy we demand, that we actually need, is but a corner of the inefficient, emission-laden, energy structure that we consume.
Most striking is the giant tail of emissions and waste that a reliance on thermal energy causes. That is our energy foot-print (today).
But, the diagram also shows that although wind and solar are only just over 1% of the total consumption, they are over 3% of the useful consumption, a new, fast-growing addition to the emission-free energy canon.
How will the future energy structure look if wind and solar keep growing quickly?
This is Not A Forecast, This is a Projection Under certain Conditions
The International Energy Agency, IEA, is fond of publishing “central projections based on current policies” which are “not forecasts”, but tend to be used and abused as if they were.
We’ll follow their lead.
Below is not a forecast, but a projection out 20 years to 2039 of the global primary energy demand under certain conditions.
It is a time-based series of global energy based on the diagram above starting with actuals in 2000 and 2018, and then projecting forward on the basis that
1 – Global energy demand grows at the current 5 year CAGR of 1.6%
2 – Wind / solar energy generation in combination grow at the current CAGR of 18.8%
3 – Thermal energy grows at the margin between these two reference points
4 – The Second Law of Thermodynamics does not change
We are happy with point 4 – the others are up for debate.
To state again, this is not a forecast, this is a projection under conditions.
Here is what running those numbers looks like – less a Sankey diagram, more a slow-motion Mondriaan:
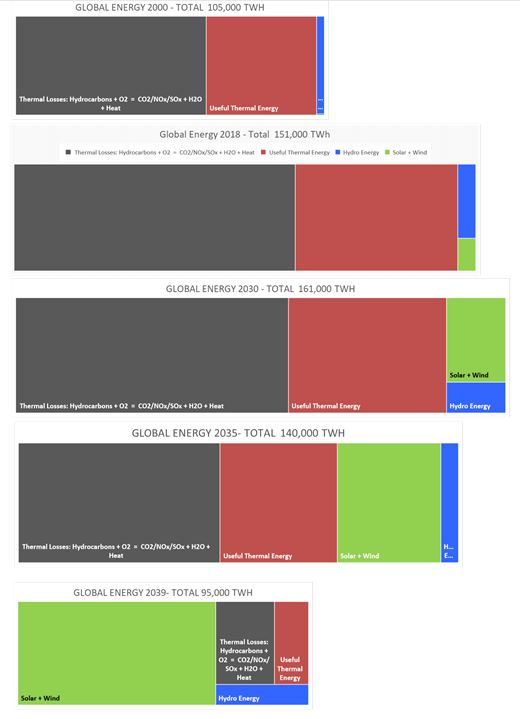
Note: aggregate world energy analysed by thermal losses, thermal useful, and wind/solar hydro useful energy demand 2000-2039 – source BP 2000 and 2018, estimates dollarsperbbl.com
Normally dollarsperbbl would use a marginal change line forecast to examine this transition.
But the chart above creates a more dynamic picture.
Three things are apparent
1. Although a negligible percentage of the overall energy system in 2000, and small in 2018 wind / solar energy are impactful because all their input is in the small corner of usable energy, and they are growing very very quickly. This is a widely over-looked fact by incumbents.
2. By 2030, that impact is so profound that it does something almost impossible to conceive right now: it will force a peak in useful thermal energy use (ca 2024-25) and total thermal energy use (ca 2027). Ponder this a second: an energy system dominant for over 150 years is within about 4-5 years of being overthrown. The chaos and turmoil inside the red box of “useful thermal energy” wherein lie the incumbent industries of coal, gas, oil, nuclear and bio-fuels, will be profound. This is played out almost weekly in uncomprehending preparations for plant closures. Because the peak in overall energy will be foreshadowed by peaks in the constituent thermal ones: likely coal, nuclear, oil, biomass then gas.
3. By 2035, solar / wind are almost 50% of total useful energy demand, and then by dint of continued exponential growth, by 2039 they are 85% of useful demand, 70% of total demand, and have relegated thermal and emissions fuels to obscurity. Total energy demand is also 35% less than in 2018, the air is cleaner, global climate temperatures are perhaps starting to stabilize.
And there is a fourth issue – cost.
The cost of the 2018 thermal energy system overall is about $6 trillion per annum, based on $60 / bbl and about 277 mboed of energy use overall (converting 13.8bn mboed to barrels)
The cost of the 2039 system based on a majority of solar and wind at a guesstimate of $10 / MWh would be $1 trillion in today’s money.
If alternatively by magic we could change our real energy needs of about 70,000TWh from thermal to solar / wind overnight, tomorrow’s energy costs would be about 50% lower even with today’s (rapidly declining) levelised cost of wind/solar energy of about $40/MWh.
This sort of logic has been used recently by BNP Paribas to note that for oil to compete as a transport fuel purely on costs, is price would have to fall to about $10-20/barrel.
Bu to restate – this is not a forecast.
But – neither is it a fantasy.
Of course, sustained wind/solar generation growth of 18.8% pa would require unprecedented levels of capacity deployment. Perhaps 10-20 times the 1.1 TW deployed today.
And the model is brutally over-simplified using today’s weighted average wind / solar rates, and avoiding complexities such as
• Sheer scale of technology deployment / efficiency
• Incumbent reaction via policy / media
• Technical structure – Top-line energy growth assumptions not interacting with solar / wind growth
And yet
• We now have a global scale energy system on a massive learning curve for the first time in energy history – so all our modelling may be wrong
• And we have the ability of energy to interconnect energy now far more deeply with core economic development via electricity, rather than be an analog thermal parallel system (how much innovation has there been in gasoline fired engines in the past 25 years or in the buying gasoline consumer model?)
Is 18.8% growth sustainable?
Wind and solar have grown together at 18.8% pa over the past 5 years, and the manufacturing improvements from rich and industrialised, very motivated fossil-fuel deficit nations, such as the EU and China, give such strong momentum a fighting chance.
Wind/solar achieved these rates despite various incumbent energy groups, pro-fossil fuel policies and immature technology development. For a while in the early 20s they may exceed that rate, so this average rate across the next 20 years is unlikely, but it far from improbable.
In any event, unless we want our deep time legacy, as MacFarlane would put it, to be a strata of plastics, radioactivity and the handprints of environmental stress, we will need a major course correction like the “projection” above.
It may not seem like it today: but perhaps we have already solved the problem, and just now need to find the resolve to see it through.
And to be silicon-crystal clear – in the longer run, across deep time, that solution is solar.
Let’s leave behind a far better legacy strata of clean pure sand, based on the deep-time erosion of solar panels, that once gave us all the energy we needed.
————- ![]() ————-
————-