
The EV Transition: The Quick and The Dead

The transition from the internal combustion engine (ICE) to EVs is now more post-event rationale than prediction.
Roadkill
A new Economist leader – Roadkill – outlines the inevitability and accelerating pace of the switch to electric vehicles (EVs), suggesting the era of the dominant ICE is now effectively over.
We agree.
This blog adheres to the hypothesis that the EV transition will follow a typical new technology S curve, not simple linear growth. And it believes most analysts are still under-estimating how quickly the EV transition is taking place.
Major new (successful) technologies often follow a pattern of slow incubation and low growth until a tipping point is reached: then explosive growth follows as widespread adoption suddenly occurs. Growth surges in non-linear ways as multiple events combine.
And an S curve trajectory has as much as cultural and emotional element as it has a mathematical one – it reflects how a slow phase of deep investment in manufacturing know-how, market testing, policy development and fashion change all tend to accumulate and then suddenly combine.
Elon Musk, CEO of Tesla, has referred to the painfulness of an S curve in his own manufacturing facilities, as $6-7 billion of capital cost over the past 5 years has to be rapidly transformed into mass-produced vehicles and batteries.
However, many analysts still focus on the overall sales of cars, rather than immediate growth trends – thereby missing the point that this marginal growth not only impacts costs and investment, but also drives investor strategies, and consumer sentiment.
So, what won’t happen in this living transition is the orderly linear process of central projections, even those from new energy advocates such as Carbon Tracker and BNEF, let alone the more conservative forecasts of the fossil fuel industry.
A Vast Prime Mover, Suddenly, Comes Online
Until a couple of years ago ICE vehicles held an almost pure monopoly on road transport, one they had held for over a hundred years.
But EV sales today command about 1.2% of global car sales, and along with mildly-electrified hybrids clearly break the pure ICE monopoly. However, this sales percentage is often used to suggest that EVs will take many, many years to impact the car market, and may even just remain niche.
Yet the history of S curves show that 1% market share is major milestone for any contender technology – it marks the threshold between the experimental phase and the move to mass market. When a technology achieves this, economies of scale, supporting infrastructure, advertising effort and so on tend to click in, reinforcing expansion.
To see how the orthodoxy of smooth change is probably underestimating EV demand by a long way, we need to delve in to the world of first derivatives – change in growth – for a minute, to see how quickly the ICE dominance of passenger cars could disappear almost overnight – that is, by 2021-22.
We can do this not be relying on long-term projections, but just using numbers that are sitting in front of us.
EV sales are growing very, very quickly, at 40-50% pa globally.
In 2017 the growth in EV sales will therefore be around 350,000 units, as total sales increase from 750,000 in 2016 to about 1.1 million this year.
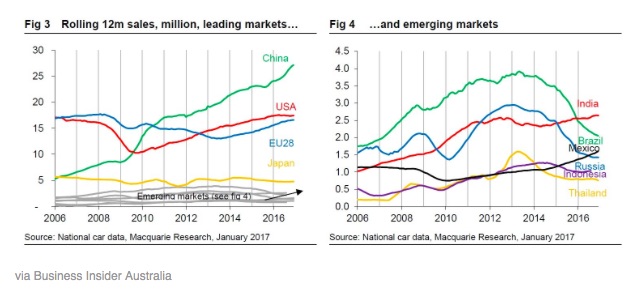
According to investment house Macquarie, world-wide passenger and light commercial car sales (EV plus ICE) grew an impressive 4.8% in 2016, from 84 million to 88 million – driven by over 13% growth in China.
However, future passenger car sales growth going is expected to slip to a more modest 2-3% pa as China’s purchasing moderates (IHS Markit suggest closer to 1.5%), and sales in other large markets (eg UK and USA) flatten out or decline – see below.
2016 Global Car Sales – Rise and Fall
So now we have enough real-time numbers to extrapolate just a couple of years out – to 2022 – to see how profoundly the global car market is about to shift – by focusing on the marginal growth of new car sales.
Let’s assume that total vehicle sales globally increase at 2.0% pa from MacQuarie’s 88m 2016 start point, and that EVs stay at around the 40-50% growth over that period, in line with today’s estimates.
We’ll use the S curve model we proposed in this post which predicts around 40-45%pa EV growth 2017-2022, rather than just choosing fixed growth rates.
In any event, here’s how those two simple projections of current data work in terms of the picture of international car sales growth, 2016 actual – 2022 estimates.

source – dollarsperbbl.com / Macquarie
Clearly 2016 is a stand out year, as total vehicle growth is over 4 million units, and EVs only 8% of this total.
But if global car sales slow to 2.0%pa growth in 2017, as latest data confirms, whilst the EV momentum continues, its clear that EVs become, suddenly, 20% of new sales growth this year, and 40% next year.
By 2020 EVs are the majority of new sales growth – a calculation unlikely to be glossed over in the boardrooms of Detroit, Germany, China and Japan. By 2022, ICE sales are in marginal decline, any growth in ICE sales permanently gone.
Last year, global car makers probably felt very comfortable with a giant rise in overall sales. But in 2017 as sales moderate, and EVs continue their growth spurt, the chart predicts ICE models drop in sales growth by over 50%, as EVs go the exact other way and grow by 50%.
In fact, in a market with negative overall growth in 2017, such as the US or UK, EVs will already be the main sector of growth – see the YTD growth figures for the UK below:

source: SMMT
Whilst manufacturers may rationalize one year’s data away because of diesel’s headline issues, the drop-off in sales of diesel for example could become permanent. All of which is lucky for EVs – they are entering a phase of major growth just as conventional car sales flatten out or decline in big markets – hence their market shares are climbing rapidly – EVs have doubled to almost 2.5% of sales in the UK over the past year.
As a plethora of new models of EVs enter the market in 2018-20 with eager marketing, this may become the point where customers choosing between an array of EVs and a problematic pure ICE vehicle make the strategic switch, for good.
As we noted, the S curve is a blend of the rational and the emotional or fashionable, and there is a clear path to these factors all coming together right now.
Marginal Growth – The Quick…
We can also look at how far gone this transition is another way, if we take three OEMs who inhabit very different start positions in the EV conversion; BMW a traditional high-end car leader; BYD a high growth new entrant from China, and Tesla.
Each of them are targeting 100,000 EV sales in 2017, up around 60-100% growth from 2016. But this is what it means in terms of percentage of their global sales

source: dollarsperbbl.com, company estimates
BMW’s hard slog to generate 4% of total sales as EVs is leading to large sales in absolute terms, but 96% of its business remains steeped in ICE dynamics.
BYD starts from a different mindset – it targets 20% of sales in its home market to be EVs, and expects future high growth – legacy ICE technology is important, but increasingly a low-growth or declining segment.
Tesla is, well, Tesla, and although still a mass-manufacturing novice, it’s an EV pure-play, and can focus on being exceptional in this area.
Whilst BMW is mired in diesel-gates and optimising two complex technology platforms, both BYD and Tesla can continue to perfect EV offers; software innovations, supply integration with battery manufacture, infrastructure tie-ups, brand extensions and so on.
Warren Buffet financed BYD can also rely on its giant local (EV-friendly) market for growth, and Tesla can hone its expertise and leverage the international brand.
Of course the integrated supply chain models may not turn out to be successful, but for incumbents like BMW, there are, suddenly, a lot of quick new competitors and competitor models to cope with; very suddenly, the choice and level of investment in core or emerging technology is increasingly complex, but increasingly critical to business survival.
For now, the stockmarket, focused on marginal change and growth, has a clear view on the outcome

source: FT
Step back from the near-future and marginal growth, and re-enter the world of right now and total sales and it’s easy to assume this all might take a long time.
EV sales are 1.2% of total car and light commercial sales, and by 2020 even with 40-50% growth they will become just 5%.
No real issue then.
Don’t be fooled – on this trajectory EV sales become 20% of total sales by 2024-5 (the point at which 2017’s new ICE purchaser is looking to trade-in), 50% total sales by 2027-8, and – well, game over.

Just ten years from now, the pure ICE passenger car is, at best, a telephone land-line – available, but barely used and preferred by a declining low-tech, low-margin niche.
A 100 year monopoly obliterated in less than 10 years.
Maybe faster.
Should we be more Cautious? No – use Moore and the Second Law
Perhaps more caution over the speed of the EV transition should be applied: many analysts will point to policy constraints, and hardware and infrastructure limitations such as battery manufacturing capacity, or re-charging stations.
However, these conservative and static views, of the speed of disruption appear to be ignoring the historical record of S curve change. Put another way, they may be falling for what Tversky and Kahneman identified as the base rate neglect, overlooking the probability of change occurring quickly as in the past, preferring, for whatever reasons, to point to obstacles in the way.
Moore’s Law has arrived in the automotive industry, and that probably changes everything – as capacity in batteries, software, charging piles and so on double, costs will typically fall by 20%: battery costs have dropped by 90% in the last six years for example.
Battery manufacturing capacity is also set to rise five times by 2020 to accommodate 5 million EV unit sales, much of the activity headed by China’s focus on energy independence and leadership in the technology.

And as an EV contains far less than 1% of the number of parts of a typical ICE, Moore’s Law is no longer a metaphor but a manufacturing reality, as the passenger car moves from off-line power plant, to on-line device.
The Second Law of thermodynamics works in favour of the EV too – it places a permanent limit on the efficiency of thermal engines – at about 25-30%.
EVs are already 2-3 times more efficient in terms of energy consumption than ICE equivalents (never mind the externalities of CO2 and NOx emissions) – and that differential will only increase as Moore’s Law inexorably drives down costs and improves performance, whilst the Second Law forces the ICE to idle.
So, caution be damned – this disruption will favor the Quick.
… and The Dead– the near future for some carmakers and oil
The rapid rise of EVs creates an equivalent downside – the rapid demise of oil demand growth.
As ICE sales decline and EV and hybrid sales increase, fuel efficiency will improve quickly to compete with non-ICE vehicles, and fend off diesel-gate issues.
But the bottom line is that as ICE vehicle marginal growth stalls, and turns negative, marginal growth in oil demand will also retreat, for good.
Too many analysts and incumbents are relying on static models of growth and change, and are not observing the live transition underway.
As EV demand enters the S curve, so oil demand will fall off exponentially – marginal growth disappears first, followed by a rapid slide downwards – summarised for global consumption below using the S curve model.

source: dollarsperbbl model
To be logically consistent, as EVs take over marginal growth by 2021-22, then marginal gasoline growth has to turn negative at about the same time, as the chart shows.
The horizontal share prices of traditional car-makers, and the range-bound flatline of oil price may already be clear signals of the near future.
————- ![]() ————–
————–
One thought on “The EV Transition: The Quick and The Dead”