
$80/bbl Might be Fatal for Gasoline
Oil’s forced surge in price as US and Chinese gasoline demand enter decline may be a fatal producer mis-step
The scale of global gasoline demand is determined by two things: the massive base-load of US on-road fleet consumption (9.3million barrels/d in 2017) and Chinese demand growth (8%pa for the past decade).
Together these two blocs absorb half of the world’s 25million barrels per day of gasoline production.
But in 2017 global gasoline growth posted only a 270,000 barrels / day growth, just a 0.9% increase versus a decade average of 1.5% pa, and a 55% drop over 2016.
As gasoline is one of the main pillars of global oil demand growth, accounting for 41% of oil product demand growth over the past 5 years, a sharp decline or even peak in its demand would quickly undermine wider oil demand.
So what is going on with gasoline demand, and is it fleeting or a structural change?
US Exceptionalism – Gasoline
To understand gasoline, first we have to understand that huge US gasoline market.
This is because of all the oil product markets, gasoline is by far the most concentrated.
The US passenger car market consumes almost 40% of total world gasoline, and over three times as much as the next largest national market, China, even though the Chinese fleet is 80% the size of the US one.
In contrast, the US only consumes about 14% of world diesel, and 20% world aviation fuel.
Thus, what happens in the US market for motor gasoline pretty quickly impacts world gasoline demand, and then pretty quickly impacts world oil demand.
In the 5 years covering 2011-2016 US gasoline demand grew an average of 115,000 barrels per day, underpinning a global annual increase of over 560,000 barrels/day.
But in 2017, US gasoline demand was essentially flat, in fact registering a small decline of around 30,000 barrels/day. Global gasoline consumption dropped as a result, as Chinese gasoline growth also slowed.

So far in 2018, see here, US gasoline and diesel demand are down a further 190,000 barrels / day.
Although still too early to be conclusive, the data is suggestive of a more systemic shift.
In fact, the normally conservative US energy department, the EIA, forecast that US light-duty gasoline consumption actually peaked in 2016.
Using the EIA estimate, by 2020 US gasoline demand will be falling at over 120,000 barrels / day per year, accelerating toward 250,000 barrels/day decline by 2023.

source: EIA – Note – each 1000 Trillion Btu drop is equivalent to 600,000 barrels / day decline – so for example between 2016 and 2020 the EIA reference case is a decline of 550 Trillion Btu per year, or 330,000 barrels/day lower consumption
A robust growth of 115,000 barrels / day per year turning to an equivalent decline just 4 years later: how so ?
The Automatic Improvements Of Technology
Most analyses of future US gasoline demand focus on the growth of sales offset by EV growth and pump price increases.
A key point to notice however is that the underlying demand trend is down, even before EV growth and price increases are included: it is structural, not cyclical.
This is due to the particular profile of the massive US operational fleet in its mature phase.
The US operating fleet is around 270 million cars, on average 11.5 years old, with sales of new cars now flat or declining at about 17million per year.
The fleet scraps about 5-5.5% per year meaning the overall fleet is growing at a flat 1-2 million per year – (incidentally this means that the 17.6m sales of conventional internal combustion engines (ICE) cars in 2016 was a peak – EV sales growth force that flat ICE demand into decline).
Whilst EV growth and rising prices will curtail gasoline demand, a much bigger impact will be felt as this large and mature fleet gradually retires its oldest vehicles.
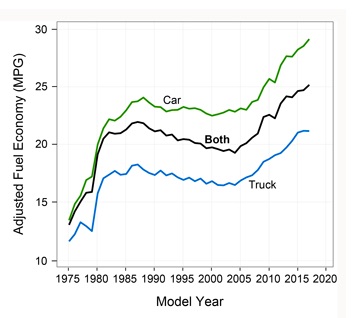
To see the impact of this, consider the average fuel economy of cars and trucks in the US over the past 40 years.
 source: EPA
US new car fleet economy only really started to improve sustainably around 2004, and by about 4-5mpg over the next ten years as engine design developed to create increasing power but with no increase in weight.
Now, whilst most commentators worried about the state of the US’s huge oil consumption will point to the need to increase fuel economy with newer models or hybrids / EVs, a simple but non-intuitive piece of maths points to something much larger going on at the lower end of fuel economy spectrum.
Consider this cocktail party question: “which saves more annual gasoline consumption: moving from a 2005, 12.5mpg gasoline Ford F150 to a newish 25mpg gasoline Toyota RAV 4, or from that newish 25 mpg gasoline RAV 4 to a brand-new 70e mpg BMW 330e plug-in hybrid?”
In fact it’s the former, and by a long way; you can amaze your friends by noting this is due to the fact that plotting a number (eg gallons per mile) against it’s inverse (miles per gallon) gives a curvilinear relationship – not a straight-line one.
See the chart below plotting it for an assumed 15,000 miles travelled per year.
That switch from the older gas-guzzling F150 to the RAV 4 saves 600 gallons per year; the RAV 4 to BMW 330e trade saves about 380.

source: dollarsperbbl; washington post
In fact, the F150 / RAV 4 switch would also equal the RAV 4 switch to a full electric Tesla 3.
But here we are looking at fleet trends rather than individual preferences (and we assume an elder F150 to Tesla 3 interchange, the most efficient move of all, is somewhat, er, atypical).
So, as the aging US on-road fleet loses its more ancient gas-guzzlers, it is now beginning to move up the fuel economy curve, on average, in an automatic way.
This becomes important as the average fleet cars start passing through that historic mpg improvement window.
Previously, as the average vehicle aged from say a 1995 model to a 2005 version, fuel consumption changed little.
However the change in fuel efficiency of the average 2005 to 2006 versions and beyond start to improve noticeably, and will continue to do as the average car increases in efficiency and the fleet loses the consumption of the scrapped or semi-retired older (vintage / classic) guzzlers.
That 4-5 mpg improvement in trucks for instance from 16mpg in 2004 to 20mpg by 2012 saves an annual 200 gallons per vehicle per annum by sheer momentum as the fleet average moves up the efficiency curve (and as it also saves $600 per year too at current prices, we can assume latest gasoline pump hikes will underpin the trend).
Three factors are thus likely to force the US gasoline demand down the accelerating curve that the EIA forecast: the natural improvement of the low economy-end of the fleet, pump price increases reducing miles travelled and consumption, and the new high-efficiency choice of the increasing number of EV models.
The latter component, EVs, also provide a permanent solution to the constant swing in energy costs of consumers are exposed to the whims of the oil market. Gasoline demand loss to EVs will therefore be permanent, unlike in the past.
Gasoline Demand Rising Elsewhere ?
Can this structural decline in US consumption be offset by Chinese, Indian or even EU demand?
The short answer is no – and in fact the same curvilinear argument can be used, but the other way round.
Starting with the second largest national fleet, China, this fleet is much younger and much more efficient than the US, having grown in era with much greater engine fuel efficiency. It can also boast EVs at 3-4% of sales and growing at over 50-60% pa.
The Chinese fleet therefore uses much less fuel overall – ca 3 million barrels / day, with the increase per year now well below 100,000 barrels / day and dropping.
The fleet is also already at the efficient end of the consumption curve: decline might be smoother, but demand upside is also much lower.
On current trajectory, especially as gasoline breaches $4.50 in major Chinese markets, Chinese gasoline consumption will peak in 2020, declining by around 100,000 barrels/day by 2025.
India can pick up demand somewhat, but the Indian fleet also starts from the efficient end of the curve, and absolute levels of consumption are only 6% of the US fleet.
The EU is a mature market that has shown some growth recently, and gasoline consumption may have renaissance as diesel share declines rapidly, but the upside is limited due to overall fleet efficiency and EV penetration.
Overall –peak global gasoline consumption occurs likeliest 2020-21 as the twin engines of its demand, US gross consumption and Chinese growth both enter decline.

Note: 2020 onwards estimates – source: BP, EIA, dollarsperbbl
Global Oil Demand Impact
We have discussed the key pillars of oil demand previously in detail: they are gasoline, diesel and NGLs.
Road fuels have driven 70% of recent growth, and NGLs for heating and petrochemicals another 20%.
This analysis suggests an absolute decline in gasoline starting 2020-21.
Some industry analyses expect diesel and NGLs to grow larger to offset the gasoline fall-off.
Our view is that the loss of such a key pillar will undermine total oil demand growth, even if diesel and NGL growth stay at current trends (ca 1.6% and 2,5% pa growth).
But even these growth trends are far from certain.
Diesel may have upside due to new MARPOL regulations requiring lower-sulphur diesel in marine vessels.
But it is also exposed to a major downturn in EU passenger car market share, and commercial vehicles moving to electric in China and elsewhere.
Likewise, NGLs can be derived increasingly from low-cost shale gas rather than refined oil.
The loss of gasoline growth, from 550,000 barrels / day growth in 2012-16, down to -250,000 barrels/day by 2023 is a huge gap for other products to fill.
Diesel for example would have to rise to over 1.0 million barrels/day growth in 2023 to keep joint demand at today’s rate.
That could only happen perhaps if oil prices collapsed making the use of gasoline and diesel more attractive.
But as near-term oil prices are going in the other direction, pushing consumers and companies alike into the arms of alternatives in an irreversible way, the outlook for oil demand is becoming increasingly dire.
Oil’s forced surge in price just as the US and Chinese gasoline markets enter systemic decline, and new EV technology emerges globally, may be a fatal mis-step taken by its producers.
————- ![]() ————-
————-